

Stir Primer part 2 some of your questions answered

1: The New York Fed publishes the Secured Overnight Financing Rate (SOFR) daily at 8:00 a.m. Eastern Time. The SOFR is a broad measure of the cost of borrowing cash overnight collateralized by Treasury securities. It is not updated throughout the day; the published rate is final for that day.
The Secured Overnight Financing Rate (SOFR) is calculated based on actual transactions in the repurchase agreement (repo) market, where borrowers obtain cash by selling securities and agreeing to repurchase them the next day. Here’s how it works:
Data Source: SOFR is derived from a wide range of transactions in the overnight repo market, specifically those secured by U.S. Treasury securities.
Transaction Volume: The calculation includes a broad set of data, taking into account billions of dollars in repo transactions. The rate reflects the volume-weighted median of transaction rates.
Calculation Method: The New York Fed aggregates transaction data from several sources, including broker-dealers and other financial institutions, to determine the rate. The SOFR is then published as a volume-weighted average of the rates for all eligible transactions.
Transparency: The calculation methodology is designed to be transparent and is published daily, providing a reliable benchmark for financial markets.
SOFR is considered a robust and reliable benchmark due to its basis in actual market transactions, making it less susceptible to manipulation compared to other rates derived from survey-based methodologies.
The settlement process for SOFR futures contracts at expiration involves several key steps:
Contract Expiration: SOFR futures contracts typically expire on the last business day of the month. On this date, the futures contract will settle based on the final SOFR rate for the reference period.
Reference Rate: The final settlement price of the SOFR futures contract is based on the average SOFR rate for the specified calculation period, usually the last three business days of the month leading up to expiration.
Final Calculation: The SOFR rate for the settlement period is calculated by the New York Fed and published the morning after the expiration date. This rate reflects the volume-weighted average of the overnight repo transactions for that period.
Settlement Type: SOFR futures are cash-settled. This means that at expiration, no physical delivery of an underlying asset occurs. Instead, the profit or loss from the position is settled in cash based on the difference between the contract price and the final settlement price.
Margining: Throughout the life of the contract, participants are subject to margin requirements, which may be adjusted based on price movements. At expiration, any final cash settlement is made, and margin accounts are reconciled.
Clearing: The settlement process is typically handled by a clearinghouse, which ensures that all trades are settled smoothly and that both parties fulfill their contractual obligations.
This process helps ensure that the SOFR futures market operates efficiently, providing a reliable mechanism for hedging interest rate risk and speculating on future interest rate movements.
SOFR futures contracts can be issued on both a monthly and quarterly basis, each with distinct characteristics. Here’s a breakdown of the differences between the two, including their respective options:
Monthly SOFR Futures Contracts
Expiration Frequency: Monthly contracts expire at the end of each month. This provides more frequent opportunities for traders to enter and exit positions.
Flexibility: Monthly contracts allow for more nimble trading strategies, as they can be used to hedge short-term interest rate fluctuations or to speculate on market movements more frequently.
Options on Monthly Contracts:
Options on monthly SOFR futures give traders the right, but not the obligation, to buy or sell the underlying futures contract at a predetermined price before expiration.
These options can be useful for strategies that require precise timing, as they provide more frequent expiration dates.
Quarterly SOFR Futures Contracts
Expiration Frequency: Quarterly contracts expire at the end of each quarter (March, June, September, December). This results in fewer expiration dates compared to monthly contracts.
Longer-Term Hedging: Quarterly contracts are often used for longer-term hedging strategies. They are suitable for market participants looking to manage interest rate risk over a longer horizon.
Options on Quarterly Contracts:
Options on quarterly SOFR futures work similarly to those on monthly contracts, but they have longer expiration cycles.
These options are beneficial for traders and hedgers looking to manage interest rate exposure over a quarter, providing more time to adjust positions if needed.
Summary of Differences
Frequency of Expiration: Monthly contracts expire once a month, while quarterly contracts expire once every three months.
Trading Strategy: Monthly contracts offer more frequent trading opportunities and flexibility, while quarterly contracts are better suited for longer-term strategies.
Options Availability: Both types of contracts have associated options, but the timing and strategy for using these options can differ based on the frequency of expirations.
Ultimately, the choice between monthly and quarterly SOFR futures contracts, along with their options, depends on the trader's or hedger's specific needs, risk management strategies, and market outlook.
Here are several sources where you can find market data for SOFR futures, including open interest and trading volume:
CME Group Website: The Chicago Mercantile Exchange (CME) is the primary exchange for SOFR futures. Their official website provides detailed information on trading volumes, open interest, and historical data for all futures contracts, including SOFR.
Visit the CME Group's "Interest Rate" section to find SOFR futures data.
Bloomberg Terminal: If you have access to a Bloomberg Terminal, you can use it to get real-time data on SOFR futures, including open interest and volume. Bloomberg offers comprehensive analytical tools and historical data.
Reuters Eikon: Similar to Bloomberg, Reuters Eikon provides access to financial data, including futures market information. You can find detailed insights on SOFR futures.
Market Data Providers: Companies like Refinitiv, FactSet, and S&P Global Market Intelligence offer financial data services that include information on SOFR futures, allowing users to analyze open interest and volume.
Financial News Websites: Websites like Yahoo Finance, Investing.com, and MarketWatch often provide market data and analysis on futures contracts, including SOFR.
Federal Reserve Economic Data (FRED): The St. Louis Fed's FRED database includes various economic data series, which may also encompass SOFR-related metrics.
Online Brokerage Platforms: Many brokerage firms that offer trading in futures might provide their clients with access to market data, including SOFR futures volume and open interest.
All contract specs, data and educational materials can be found on the CME web site for your review. They also offer educational materials, testing and sim trading. Signing up to create a new account is free.
https://www.cmegroup.com/education/browse-all.html
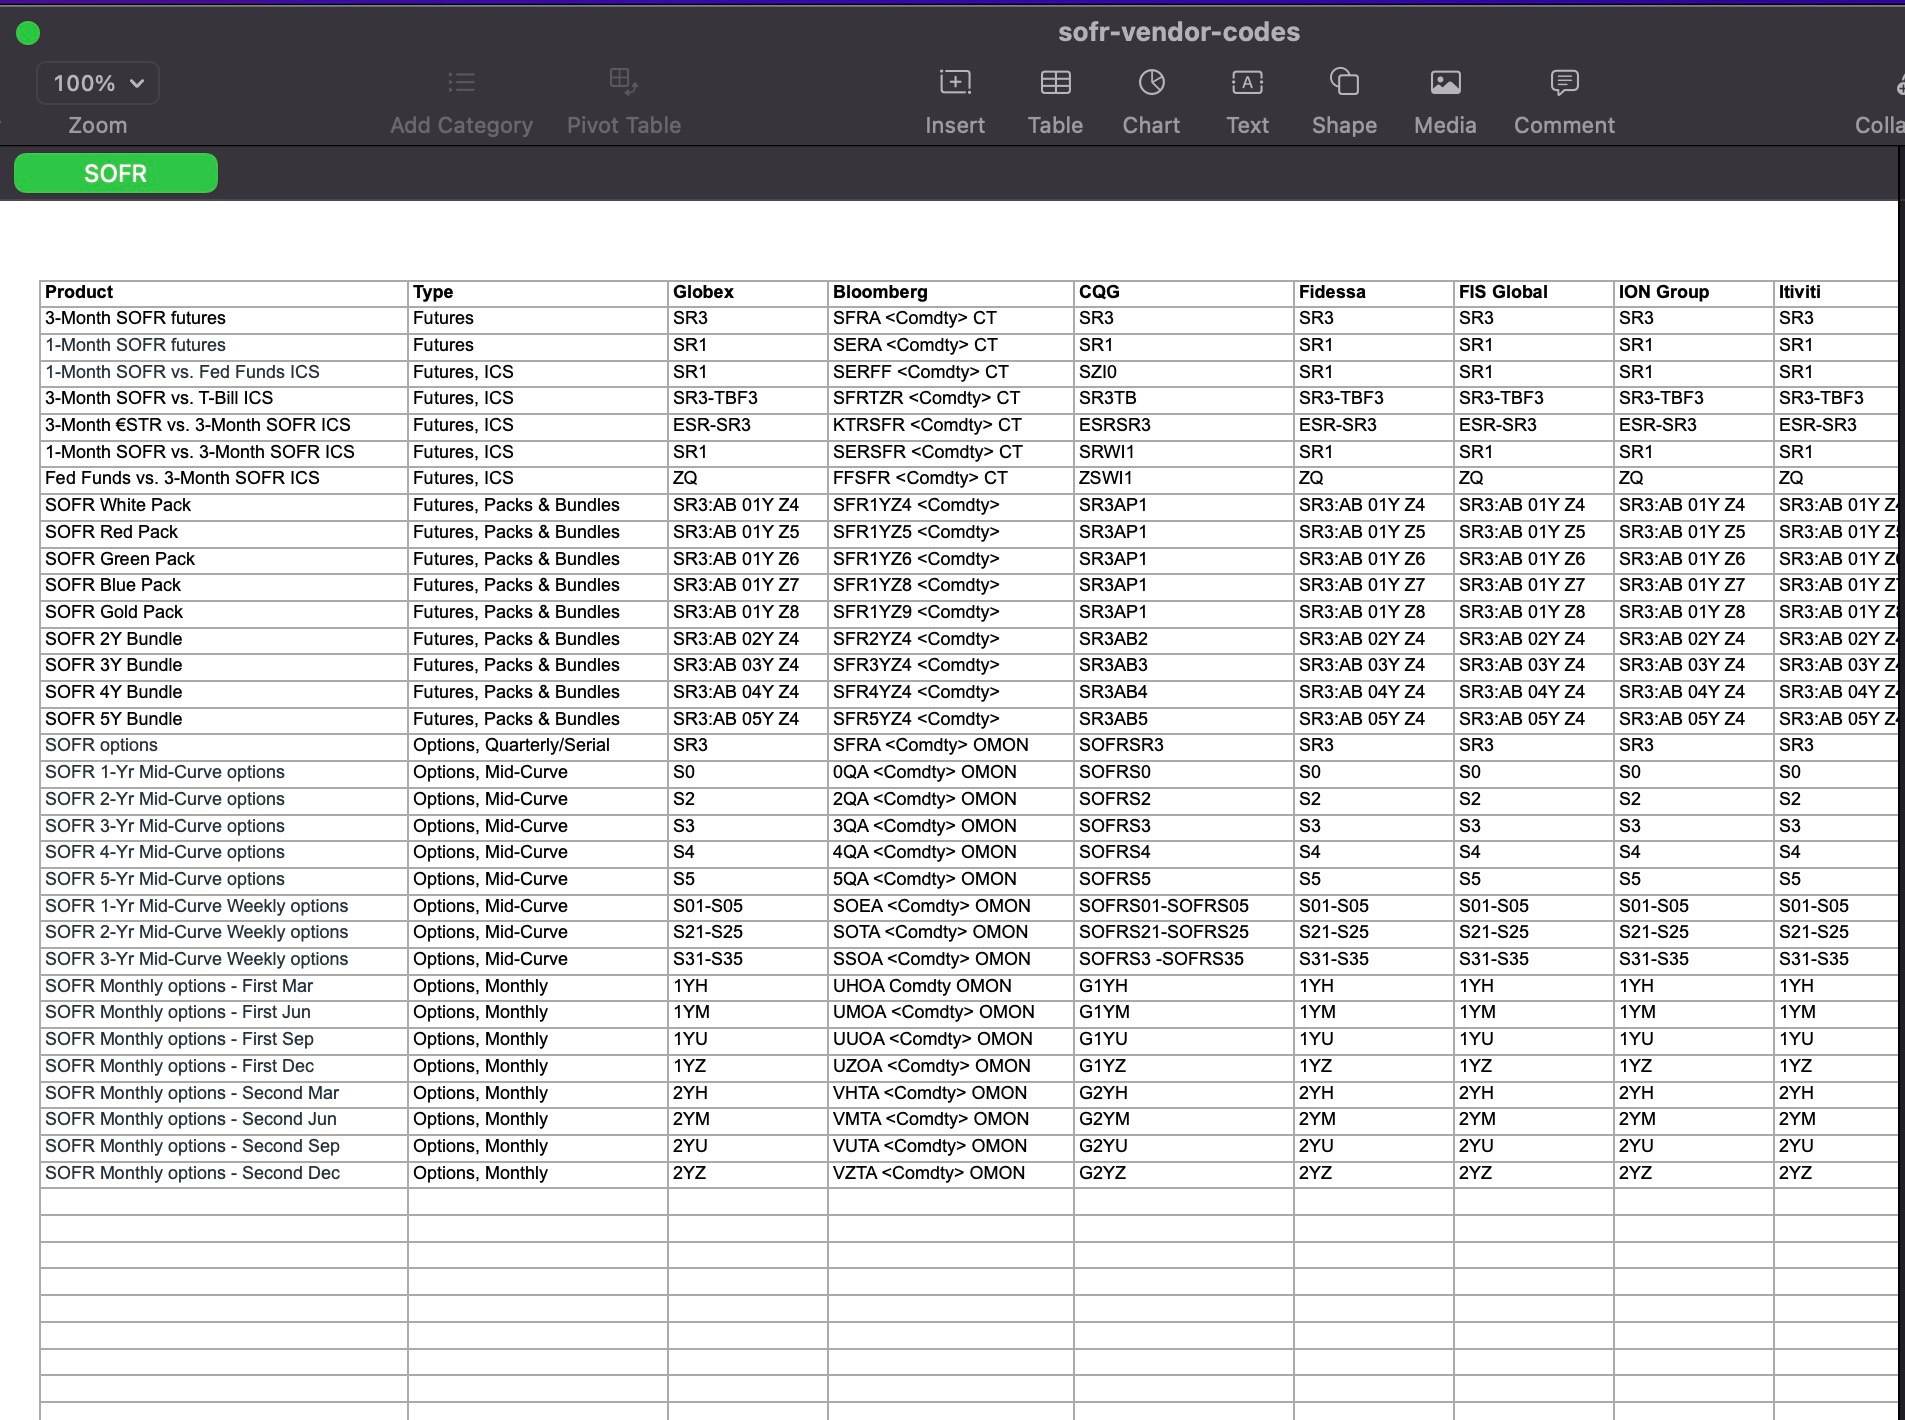
The color-coded packs and bundles for SOFR futures are part of a visual representation used in trading and market analysis to categorize and differentiate various contracts based on their expiration dates and characteristics. Here’s a general overview of how these color codes typically work:
Color Coding: Each color represents a different time frame or maturity for the futures contracts. This helps traders quickly identify and analyze contracts that fall within specific periods.
Bundles: Bundles usually consist of multiple contracts grouped together, often representing a set of expirations (e.g., quarterly or monthly). For instance:
Red: Typically represents shorter-term contracts, such as those expiring in the next few months.
Green: Usually denotes contracts that are near the middle of the curve, such as those expiring in 1 to 2 years.
Blue: Often signifies longer-term contracts, such as those expiring in 5 years or more.
Market Analysis: Traders use these color-coded packs to make strategic decisions based on the interest rate environment, economic outlook, and market conditions. The visual differentiation helps in quickly assessing the landscape of available futures.
Trading Platforms: Different trading platforms may have variations in their color coding, so it's essential to refer to the specific documentation or help resources of the platform you are using to understand their particular color conventions.
For precise details on the specific colors used for SOFR futures on a given platform, it’s best to consult the trading platform’s user guide or the CME Group's resources directly
.
SOFR block trades are subject to specific reporting requirements to ensure transparency in the market. For block trades executed in SOFR futures, the reporting delay is typically set at 15 minutes. This means that block trades must be reported to the exchange within 15 minutes of execution.
Block trades are larger transactions that can be negotiated privately, and this reporting helps maintain market integrity by ensuring that significant trades are made publicly available within a reasonable timeframe.
For the most accurate and up-to-date information, it's recommended to check the CME Group's official documentation or trading rules regarding block trades and their reporting requirements.
SOFR strips, spreads, and flies can exhibit varying levels of liquidity in the market:
Liquidity of SOFR Strips, Spreads, and Flys:
Strips: These are sequences of futures contracts, typically used for hedging or speculating on interest rate movements over a period. They can be relatively liquid, especially if they correspond to popular maturities.
Spreads: These involve taking a position in two different futures contracts (such as buying one contract and selling another). Spreads can be liquid, but their liquidity often depends on the specific contracts involved and market conditions.
Flys: This strategy involves three different maturities and can be less liquid than strips and spreads. The liquidity of flys can vary significantly based on market interest and the specific contracts used.
Market Making:
The liquidity of these instruments may require market makers (MMs) to enhance trading activity. While some strips and spreads might have enough trading volume to create a natural market, MMs play a crucial role in providing liquidity, especially for less actively traded combinations or in more volatile market conditions.
The CME does not explicitly bootstrap an order book for these spreads or strips; instead, market makers often facilitate trading by quoting prices and ensuring that there is a market available for participants.
For clarity I am not an expert on SOFR Futures and even less so in the options arena!
Options on 3-month SOFR futures are financial derivatives that give the holder the right, but not the obligation, to buy or sell a futures contract at a specified strike price before a certain expiration date. Here’s a discussion on this topic along with the concept of volatility:
Options on 3-Month SOFR Futures
Purpose: These options allow market participants to hedge against or speculate on changes in short-term interest rates. Given that SOFR reflects the cost of borrowing cash overnight collateralized by U.S. Treasury securities, options on SOFR futures are particularly relevant for interest rate risk management.
Pricing: The pricing of these options is influenced by several factors, including the underlying SOFR futures price, the strike price of the option, time to expiration, and prevailing interest rates. The Black-Scholes model or other options pricing models are commonly used to value these options.
Liquidity: Options on 3-month SOFR futures typically attract significant liquidity, particularly from institutional investors and traders looking to manage interest rate risk.
Concept of Volatility
Volatility in Percent Terms: Volatility is often expressed as a percentage, representing the annualized standard deviation of returns. However, when interest rates are near zero, interpreting volatility as a percentage can become less intuitive. For example, a 10% volatility in a near-zero interest rate environment can imply very small actual movements in rates.
Standard Deviation in Basis Points (bps): In the context of interest rates, it may be more coherent to think of standard deviation in terms of basis points (bps) per day. For instance, if the annualized volatility is expressed in bps, you can convert it to daily volatility by dividing by the square root of the number of trading days in a year. This allows for a clearer understanding of the potential daily fluctuations in interest rates.
Conversion Example: Conversion Example: If the annualized volatility is 100 bps, the daily volatility can be approximated as: Daily Volatility≈√252100 bps ≈6.3 bps per day
Practical Implications: Understanding volatility in this way helps traders and risk managers gauge the potential risk and reward of their positions in options on SOFR futures. It allows them to assess how much the underlying interest rates might move on a daily basis, providing a more precise picture of risk.
In the context of options on interest rate futures, particularly with 3-month SOFR futures, the premium skew generally refers to the difference in implied volatility between call options and put options. Here's how it typically plays out:
Premium Skew: Calls vs. Puts in a cutting cycle
Call Options:
In a low or declining interest rate environment, call options on SOFR futures can often have higher premiums compared to puts. This is because lower rates are typically associated with increased market stress or economic uncertainty, leading to a greater demand for calls.
Investors may buy calls to hedge against the risk of falling rates, which can increase the value of their existing fixed-income portfolios. This heightened demand can drive up the premiums for calls, creating a call skew.
Put Options:
Conversely, put options may have lower premiums in this scenario. While puts provide protection against rising interest rates (which could lead to falling bond prices), the demand for them may not be as strong during periods when rates are expected to drop or remain low.
As a result, the implied volatility for puts may be lower, leading to a less pronounced or even negative skew compared to calls.
Market Stress and Interest Rates
The relationship between falling rates and market stress is crucial. When market participants anticipate economic distress, they may expect rates to drop as central banks cut rates to stimulate the economy. This leads to increased purchasing of call options, hence driving up their premiums.
During a Federal Reserve tightening cycle, where the Fed raises interest rates to combat inflation or stabilize the economy, the skew of options on interest rate futures, such as those on 3-month SOFR futures, can change in several ways:
Changes in Skew behavior During a Fed Tightening Cycle
Increased Demand for Puts:
As the Fed tightens monetary policy, market participants may anticipate rising interest rates. This can lead to increased demand for put options, as investors seek to hedge against the risk of higher rates, which typically result in lower bond prices.
The heightened demand for puts can lead to an increase in their premiums, resulting in a steeper skew toward puts compared to calls.
Decreased Demand for Calls:
Conversely, the demand for call options may decrease in a tightening environment. As interest rates rise, the attractiveness of holding long positions in fixed-income securities diminishes, leading to reduced interest in call options on futures.
This can result in lower premiums for calls, further contributing to the skew.
Increased Volatility Expectations:
A tightening cycle can create uncertainty in the markets, leading to increased volatility expectations. This can affect the implied volatility of options, typically causing puts to exhibit higher implied volatility compared to calls as traders brace for potential market movements.
This change can further steepen the skew in favor of puts.
Market Sentiment:
The overall market sentiment during a tightening cycle is generally more cautious. Traders may expect potential economic slowdowns, which can lead to a preference for protective strategies, including buying puts.
This shift in sentiment can reinforce the premium skew toward puts.